Monday, April 22, 2024

The polls are getting close

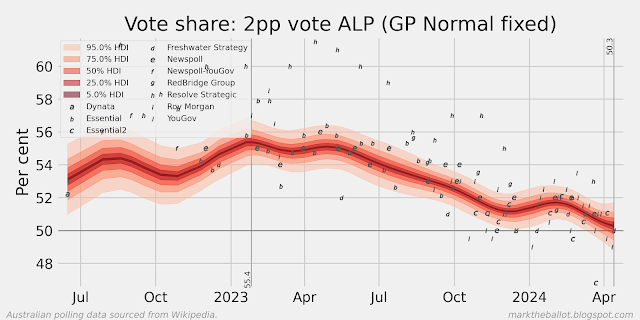
I have updated my poll aggregations, and it is getting close. The Gaussian Random Walk (GRW) model has Labor on 50.1 per cent of the two-party preferred (2pp) vote share if an election was held now. The less tested Gaussian Process (GP) model has Labor on 49.7 per cent.


My simple local regression models have the 2pp vote share at 50 per cent even. 


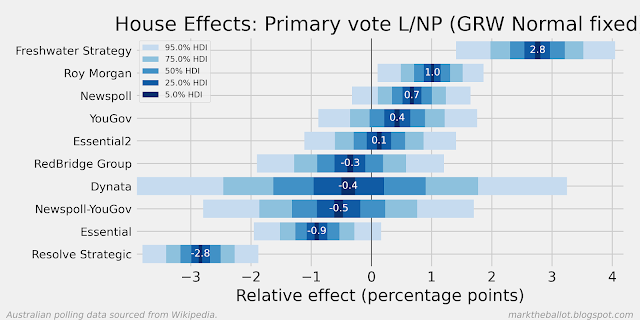
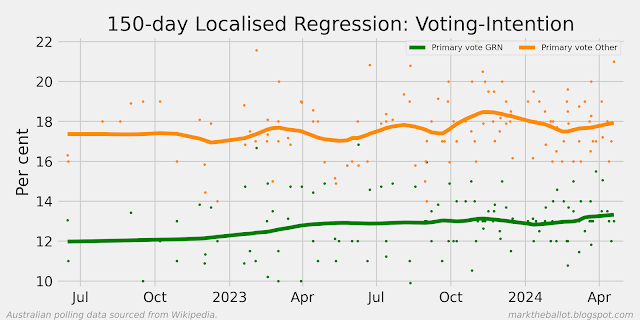
Nonetheless, there remains a substantial primary vote for the non major parties, which makes it harder to project who will form government on the basis of the 2pp vote share.


Comments

At this point, my best guess is that the polls are currently pointing to a minority Labor government, with an increased cross bench. 

Part of the reason I have Labor ahead when the 2pp polling aggregte is around 50/50 is historical. First term governments usually win a second term. There is an inertia built into the super-majorities governments typically get in their first term (and with the Herculean task faced by oppositions to rebuild after change-of-government elections). The last one-term Federal government was the Scullin government that had the misfortune of being elected just after the 1929 Wall Street Crash, in the midst of the Great Depression.

A second reason is that the 2pp poll aggregates have only just hit 50/50. I would want to see the 2pp poll aggregates consistently below 50 per cent for some months before seriously reconsidering Labor's chances at the next election. Governments have the advantage going into an election. They have the advantage in setting the date for an election, and they can use the expertise of the public service to better prepare for an election (before it has been called). 

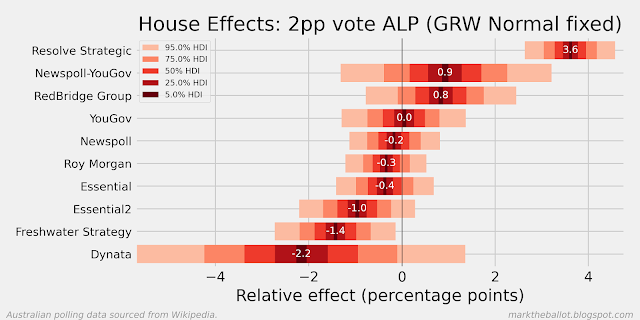
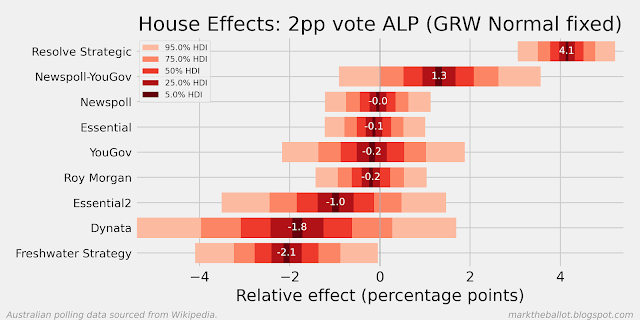
A third reason for caution is the possibility that the latest Resolve Strategic poll is a statistical outlier. That 2pp poll came in at 50/50, but in the aggregation models, given historical systemic house bias patterns, the latest poll was treated more like 53.5 for the Coalition and 46.5 for Labor. It is possible that Resolve Strategic has changed its polling methodology, and we will therefore need to change how we treat these Resolve Strategic polls in the future. Ot it could just be part of the usual noise of opinion polling, and going forward we will see the long-standing systemic bias patterns return to how they have been.

Finally, it is worth noting that getting less than 50 per cent of the 2pp vote does not necessarily mean defeat. Governments have won in the past with narrow 2pp vote losses. For example: Howard in 1998 with 49.0 per cent, Hawke in 1990 (49.9%), Gorton in 1969  (49.8%), and Menzies in 1961 (49.5%) and 1954 (49.3%). 

Wednesday, April 17, 2024

Various Bayesian models for modelling voting intention

I run a number of Bayesian models of voting intention for the next Australian Federal election. 

The first is a Gaussian Random Walk (GRW) which models the voting intention by assuming (1) voting intention on any single day only varies a little from the day before, (2) the polls are a noisy indication of population voting intention, and (3) individually pollsters have systemic biases but collectively across all pollsters the polls are unbiased. This is the same model I have used in past elections. It is also my preferred model. At the moment it shows Labor two-party preferred (2pp) voting intention at 50.7 per cent.


The second model I run - a Gaussian Random Walk with a Left Anchor (GRWLA) - augments the first model by anchoring the hidden voting intention to the result at the last election. By imposing a left anchor, I am assuming some things: First, that any honeymoon effect after the election is consistent with my assumption of minimal voting intention change from day to day. Second, that pollsters retain the same methodological approach from the time of the last election. I am not convinced by either of these assumptions. At the moment it has Labor's 2pp voting intention at 49.2 per cent.


The third model I run is a Gaussian Process (GP) model. Rather than model hidden voting intention on every day, it only models hidden voting intention on polling days. The model assumes that the hidden voting intention for polls that are nearby in time will be more correlated than for polls that are further away in time. This relationship between polls based on their temporal distance from each other is expressed mathematically in the model using an exponentiated quadratic kernel. Like the above models, this model also makes adjustments for systemic pollster biases. At the moment it has Labor's 2pp voting intention at 50.3 per cent.

I am still exploring this approach, however, it is sensitive to where the "mean" across the data points is set (with a strong tendency to mean reversion at each end of the series, and for periods through the series where there are few polls). I have set the mean to the average of the last 10 polls. 


We can compare the central tendencies of these approaches as follows. You will note the "mean reversion" evident in the early part of the GP series.


These models are encoded in Python and they can be seen on my github repository. If you want to look at the models closely, you should look at bayes_tools.py and the notebook _poll_agg.ipynb

The GRW and GRWLA models are based on the work of Simon Jackman in Bayesian Analysis for Social Sciences (2009).

Wednesday, November 22, 2023

Morgan Poll

Latest Roy Morgan poll is not good news for Labor. This is the second recent Morgan poll with Labor's 2pp vote share below 50%. Morgan has Labor's primary vote below 30 per cent for the first time this election cycle.


Monday, November 20, 2023

Updated polling charts

The updated localised regression chart suggests that two-party preferred voting intention for Labour continues to decline. 

However, this decline is not as marked on the Bayesian Gaussian Random Walk (GRW) model. This model assumes that:

  • how the whole population will vote on any given day is very similar to the day before (this is the Gaussian Random Walk in the model)
  • opinion polls provide an irregular and noisy indication of how people would vote; and
  • the individual pollsters have unintended methodological biases that tend to favour one party over another over time. For the purposes of the model, these house effects are assumed to cancel each other out across all pollsters, ie. they sum to zero across all of the polling houses. 
With these three factors, the model finds the most likely day-to-day pathway for population voting intention. 


The Gaussian Process (GP) model, has a similar approach to identifying and managing house-effects as the Gaussian Random Walk, but it models voting intention using a covariance matrix, with a higher covariance for polls that are closer together in time. The covariance function I used is the exponentiated quadratic kernel (with a length scale of 50 - "ell" in the denominator). This model produces a similar aggregation result, although it suggests that the recent poll movement away from Labor is less intense.


Collectively, the central tendency of these models can be seen in the following chart. The following chart also includes a left-anchored series (labeled GRWLA) which is a Gaussian Random Walk that has been left-anchored to the election result at the previous election. The house effects in the the GRWLA model do not sum to zero.


Turning to primary votes. The most significant trend is Labor's decline. The Coalition is up on where it was six months ago (but may be in decline at the moment). The Greens may be up on where they were six months ago. The vote for others and independents also looks up.


The data for these charts is sourced from Wikipedia. Before analysis, the polling data is treated to ensure that:
  • undecided respondents are proportionately allocated where necessary, and 
  • the two-party preferred and primary votes are normalised to sum to 100 per cent exactly. 
The notebooks that produced these charts are available on my github site.